Store operations dashboard
Vitrin Console
A back office for a retailer with several locations.
- Platforms
- Desktop web
- Engagement
- All delivered under NDA to private clients, who own what we built. Screens are representative: no client names, no user data.
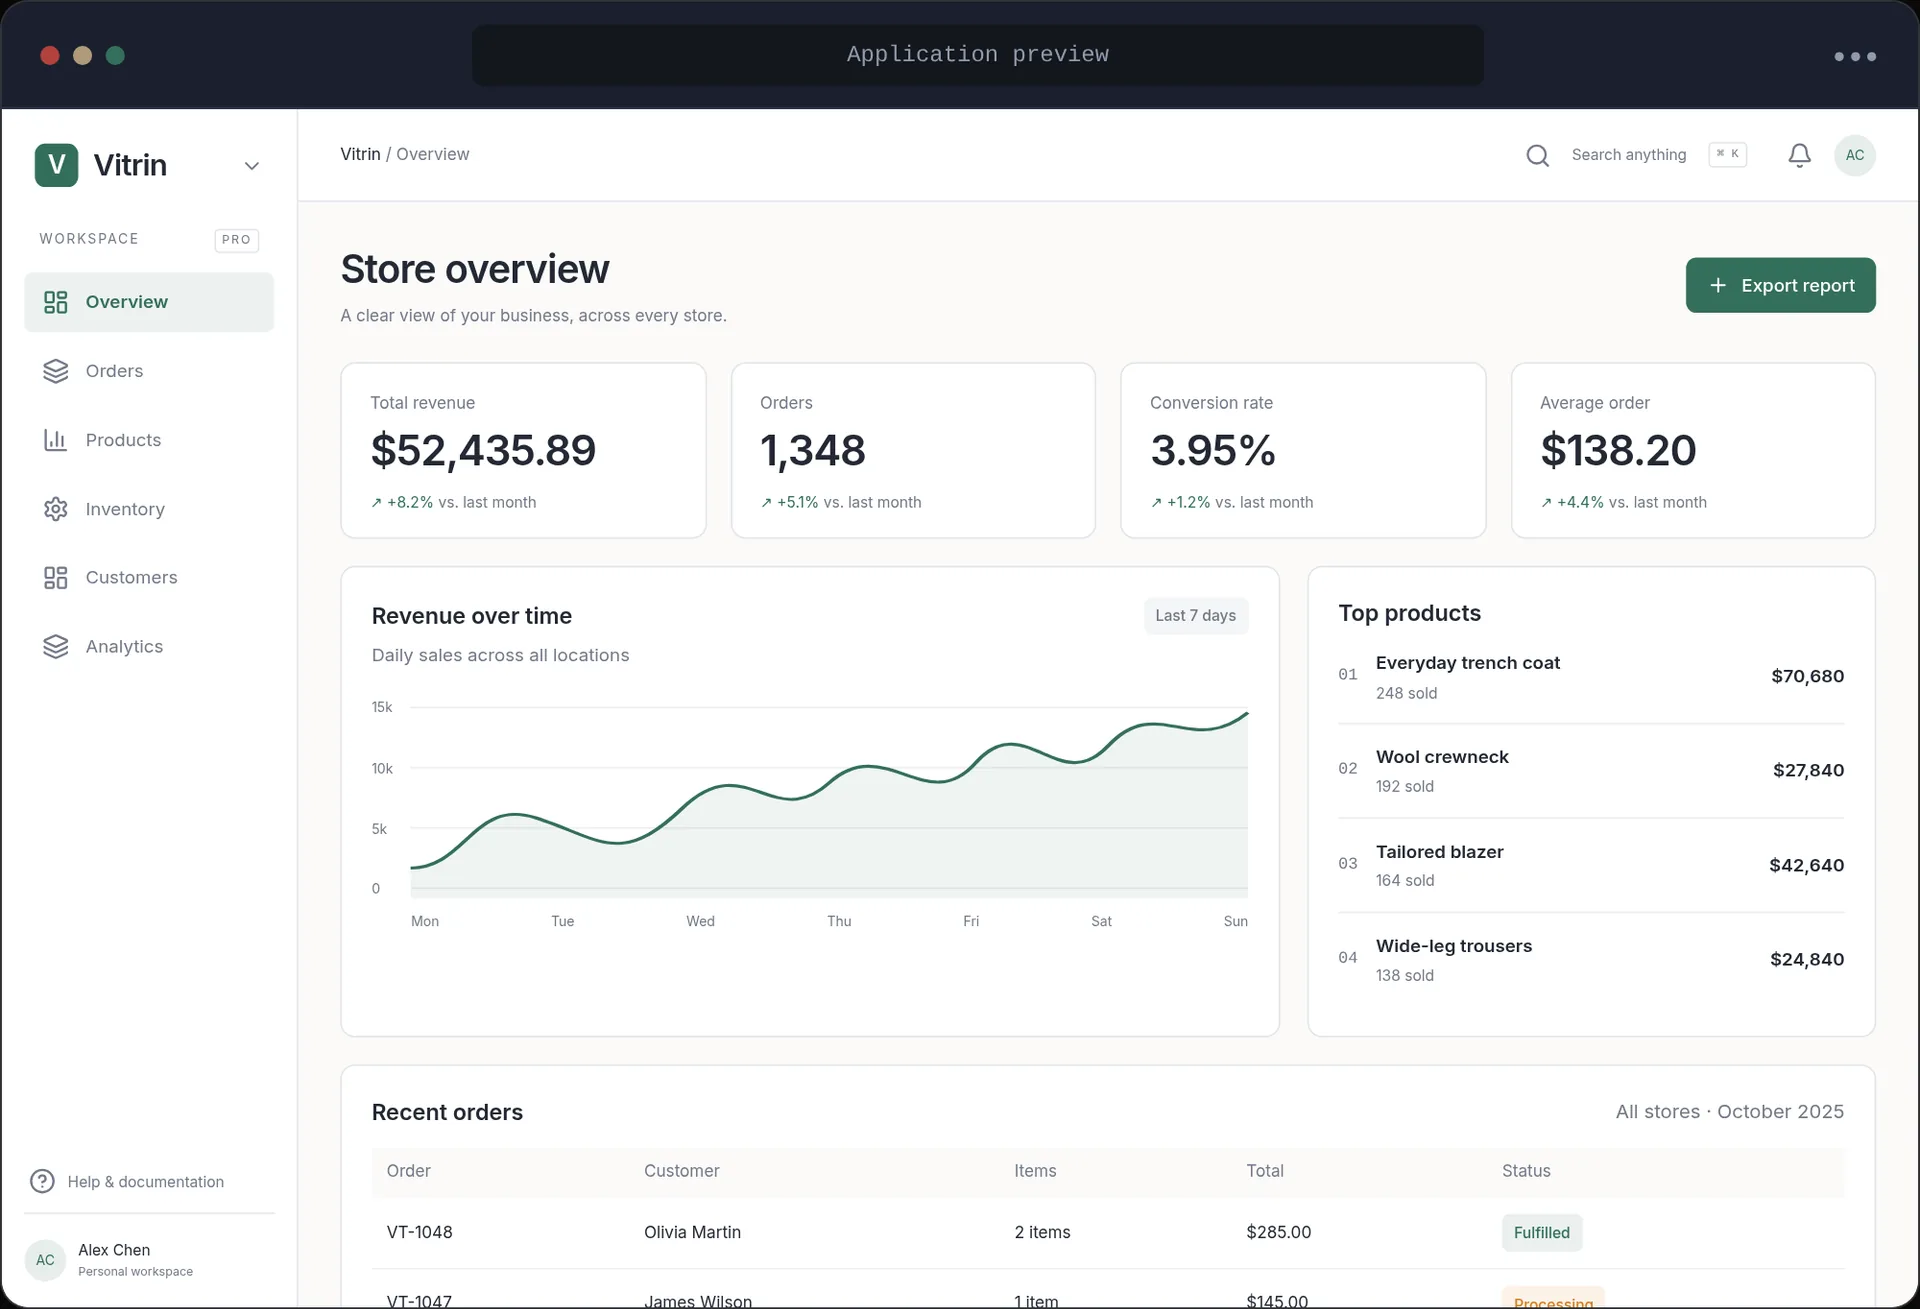
Built for store managers who need the morning picture before the first customer: what sold, what is running low and which orders need a decision.
The problem
Managers assembled that picture from exports and messages. Each location sent the same figure in a different format, and the version on screen was rarely the current one.
What we decided
Key figures sit at the top, each with the period it is compared against.
Revenue is drawn over the week, and the tables below stay filtered to the same range.
Orders filter by store and by status, with the number of matches stated above the list.
Loading and empty states are designed: a quiet morning is a normal state for a dashboard.
Table text is set at a readable size first; density is added around the type, not into it.
Screens